Prometheus vs VictoriaMetrics: Which Time Series Database Should You Choose in 2026?

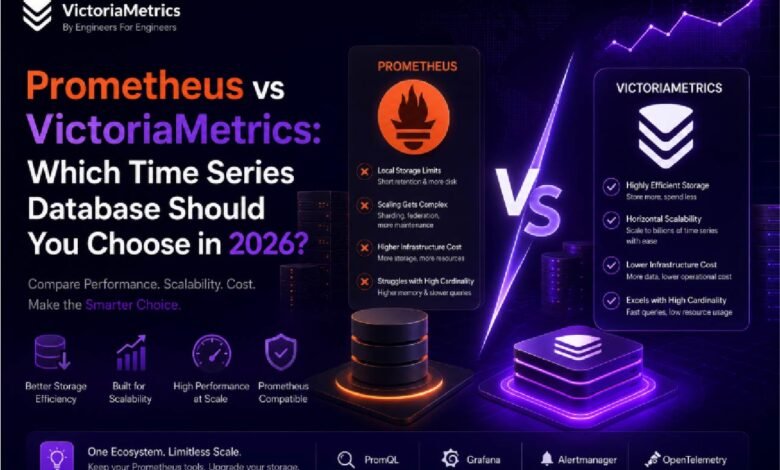
Modern applications generate an unprecedented volume of metrics. From Kubernetes clusters and microservices to cloud infrastructure and IoT devices, engineering teams depend on reliable monitoring to maintain performance and quickly resolve issues. While Prometheus has become one of the most widely adopted monitoring systems, growing infrastructures have exposed limitations in storage, scalability, and long-term retention. As a result, many organizations are evaluating Prometheus vs VictoriaMetrics to determine which platform is better suited for modern observability.
Although Prometheus remains an important part of the cloud-native ecosystem, it was never designed to be the ultimate solution for storing massive amounts of time series data over long periods. VictoriaMetrics was built specifically to solve these challenges. It delivers a high-performance time series database that is fully compatible with the Prometheus ecosystem while offering better storage efficiency, lower infrastructure costs, and significantly improved scalability.
Understanding the Difference
One of the biggest misconceptions is that Prometheus and VictoriaMetrics directly compete as identical products. In reality, they solve different problems.
Prometheus is primarily responsible for scraping metrics, evaluating alerting rules, and providing a local storage engine. It works exceptionally well for collecting metrics from applications and infrastructure.
VictoriaMetrics, on the other hand, focuses on becoming the storage and query engine that modern monitoring platforms require. It integrates seamlessly with Prometheus, allowing organizations to continue using their existing exporters, dashboards, and PromQL queries while replacing the storage layer with a solution designed for scale.
Instead of rebuilding your monitoring stack, VictoriaMetrics enhances it.
Storage Efficiency Matters More Than Ever
As monitoring environments grow, storage quickly becomes one of the largest operational expenses. Every new Kubernetes pod, container, virtual machine, or cloud service generates additional metrics. Over weeks and months, this data grows into billions of samples.
Prometheus stores data locally and performs well for shorter retention periods. However, extending retention often means allocating additional disk space, increasing memory requirements, or deploying external storage solutions. This adds complexity while increasing infrastructure costs.
VictoriaMetrics approaches storage differently. Its storage engine is built specifically for efficient compression and optimized indexing. By reducing the amount of disk space required to store metrics, organizations can retain historical monitoring data for much longer without dramatically increasing infrastructure costs.
For companies managing enterprise environments, this storage efficiency translates into lower operating expenses while maintaining fast query performance.
Built for Scalability
Scalability is where VictoriaMetrics begins to separate itself from traditional Prometheus deployments.
A single Prometheus server works well for relatively small infrastructures, but scaling beyond that often requires federation, sharding, or deploying multiple independent servers. While these methods solve immediate scaling challenges, they also increase operational complexity and maintenance overhead.
VictoriaMetrics was designed with horizontal scalability from the beginning. Whether monitoring hundreds of servers or thousands of Kubernetes nodes, it can efficiently handle growing workloads without requiring organizations to redesign their monitoring architecture.
This makes VictoriaMetrics particularly valuable for organizations operating:
- Large Kubernetes clusters
- Multi-region deployments
- Multi-cloud environments
- Enterprise SaaS platforms
- High-volume telemetry systems
As infrastructure grows, the monitoring platform should scale with it instead of becoming another operational challenge.
Performance at Scale
Fast queries are essential for troubleshooting production issues. Engineers cannot afford to wait for dashboards to load during an incident.
Prometheus delivers strong performance for recent datasets stored locally. However, query performance can become more challenging as datasets grow larger and retention periods increase.
VictoriaMetrics is optimized for large-scale workloads. Its storage architecture allows engineers to query massive historical datasets efficiently while maintaining responsive dashboards and alert evaluations.
Whether analyzing data collected over several days or multiple months, VictoriaMetrics is engineered to provide consistent performance across large environments.
As organizations increasingly rely on data to understand performance and make informed decisions, professionals need strong analytical and technical skills to work with complex datasets. Those looking to build a foundation in data analysis, statistics, machine learning, and modern data technologies can consider a data science course. Developing these skills can help learners prepare for data-driven roles across technology and business.
A Seamless Prometheus Alternative
Replacing monitoring platforms is usually expensive and disruptive. Fortunately, migrating to VictoriaMetrics does not require organizations to abandon their existing Prometheus ecosystem.
VictoriaMetrics supports:
- Prometheus scraping
- Prometheus Remote Write
- PromQL queries
- Grafana dashboards
- Alertmanager
- Kubernetes service discovery
- OpenTelemetry metrics
This compatibility allows engineering teams to improve storage and scalability without rebuilding exporters, dashboards, or operational workflows.
For organizations searching for a practical Prometheus alternative, compatibility is one of VictoriaMetrics’ strongest advantages.
Better Handling of High-Cardinality Metrics
Modern cloud-native applications generate high-cardinality metrics through dynamic infrastructure, containers, labels, and microservices.
As cardinality increases, traditional monitoring systems consume more memory, require additional storage, and experience slower queries. These challenges become increasingly visible in Kubernetes environments where workloads constantly change.
VictoriaMetrics is specifically engineered to manage high-cardinality workloads more efficiently. Its optimized indexing strategy enables organizations to monitor complex distributed systems without sacrificing performance or dramatically increasing infrastructure requirements.
This makes VictoriaMetrics an excellent choice for engineering teams building modern observability platforms.
Lower Operational Complexity
Infrastructure costs are not limited to hardware. Operational complexity also impacts engineering productivity.
Large Prometheus deployments often require multiple supporting components to achieve long-term storage, high availability, federation, and scalability. Maintaining these components increases operational effort and creates additional failure points.
VictoriaMetrics simplifies this architecture by providing a storage platform capable of supporting everything from small deployments to enterprise-scale environments. Fewer components mean easier maintenance, simpler upgrades, and lower operational overhead.
Instead of spending time managing monitoring infrastructure, engineering teams can focus on improving application reliability.
Which Solution Should You Choose?
If your environment consists of a few services with relatively short metric retention requirements, Prometheus can still serve as an effective monitoring solution.
However, most modern organizations are experiencing continuous infrastructure growth. Kubernetes adoption, cloud-native applications, distributed services, and AI workloads generate significantly more telemetry than traditional systems.
In these environments, VictoriaMetrics provides clear advantages:
- Better storage efficiency
- Lower infrastructure costs
- Faster performance on large datasets
- Horizontal scalability
- Excellent support for high-cardinality metrics
- Full compatibility with the Prometheus ecosystem
- Easier long-term operations
Rather than replacing everything you already use, VictoriaMetrics strengthens your existing monitoring stack while preparing it for future growth.
Final Thoughts
The discussion around Prometheus vs VictoriaMetrics is no longer just about choosing a monitoring tool—it is about selecting a platform capable of supporting the future of your infrastructure.
Prometheus transformed cloud-native monitoring and remains an essential part of many observability stacks. But as organizations demand longer retention, larger datasets, and more scalable architectures, its built-in storage engine becomes a limiting factor.
VictoriaMetrics addresses these challenges by delivering a modern time series database optimized for performance, scalability, and operational simplicity. Because it integrates seamlessly with Prometheus, engineering teams can improve their monitoring platform without disrupting existing workflows.
For organizations planning long-term growth, adopting VictoriaMetrics is not simply an infrastructure upgrade—it’s an investment in a monitoring platform designed to scale with modern applications. If your goal is to reduce storage costs, improve query performance, and simplify operations while remaining fully compatible with Prometheus, VictoriaMetrics stands out as the smarter choice for 2026 and beyond.